Steam is a popular online store for computer video games. I scraped Steam and steamDB data for every video game available for purchase through Steam and then performed linear regression to predict the number of concurrent users. This was done using Selenium and Python. Many Python packages were used including pandas, seaborn, stats models, scikitlearn, fuzzywuzzy.
Example game page:

I used a combination of Selenium webdriving and beautiful soup to scrape the data.
Variables collected for each videogame included:
- Price
- Discounted Price
- Number of overall reviews
- Number of recent reviews
- Percentage of positive overall reviews
- Percentage of positive recent reviews
- Metacritic score
- ESRB Rating
- Reasons for the ESRB Rating
- User-defined tags
- Genre(s)
- Publisher(s)
- Developer(s)
- Release Date
Linear regression:
I attempted to predict peak concurrent users scraped from SteamDB using these independent variables.
Linear regression models were made using ordinary least squares, select k-best features, and both lasso and ridge regularization. Ultimately, ridge regularization performed the best so far.
It was important to use regularization for this dataset, because I had nearly 10000 features after unpacking all of the categorical features such as the user-defined tags. Before performing regularization, I was able to cut down this number substantially by removing features that were not represented much in the dataset. Removing categorical features associated with fewer than 10 games (an arbitrarily chosen number) cut down the values to around 900 features. 900 features was still quite a few and made the dataset prone to overfitting to the training data.
It seems likely that the negative coefficients for oculus and VR user tags are due to the relatively low adoption of these types of games so far. There is still a high monetary barrier to entry for these games due to the cost of VR systems, particularly the oculus rift, and these systems are still relatively new for widespread adoption.
I’ve also used a Poisson regression, since this data is more appropriately modeled with a Poisson, given that it’s count data with a log distribution. Comparing performance between the log-transformed linear regression and the Poisson regression is not that straightforward, however, since we’d need to calculate a pseudo-R^2 value when using functions from the generalized linear models family.
I’ve since updated (as of 06-07-18) this to use data from the entirety of Steam’s videogame collection and predict the number of overall reviews (which I’m treating as a good proxy for the number of unique owners). I achieve a test R^2 value of .85 in log space and a test R^2 value of .65 if I remove the Metacritic score and the percentage of reviews that are positive. This tells us two things. 1) Since the relationship between the Metacritic score and percentage of positive reviews are both positive, we can say that games that are reviewed well are more popular and vice versa. The Metacritic score and percentage of positive reviews are both features that we would only know after a game has been released. 2) The remaining features show that we can predict whether a game will be popular ahead of time given information about the genre, publisher, etc.
Some hurdles:
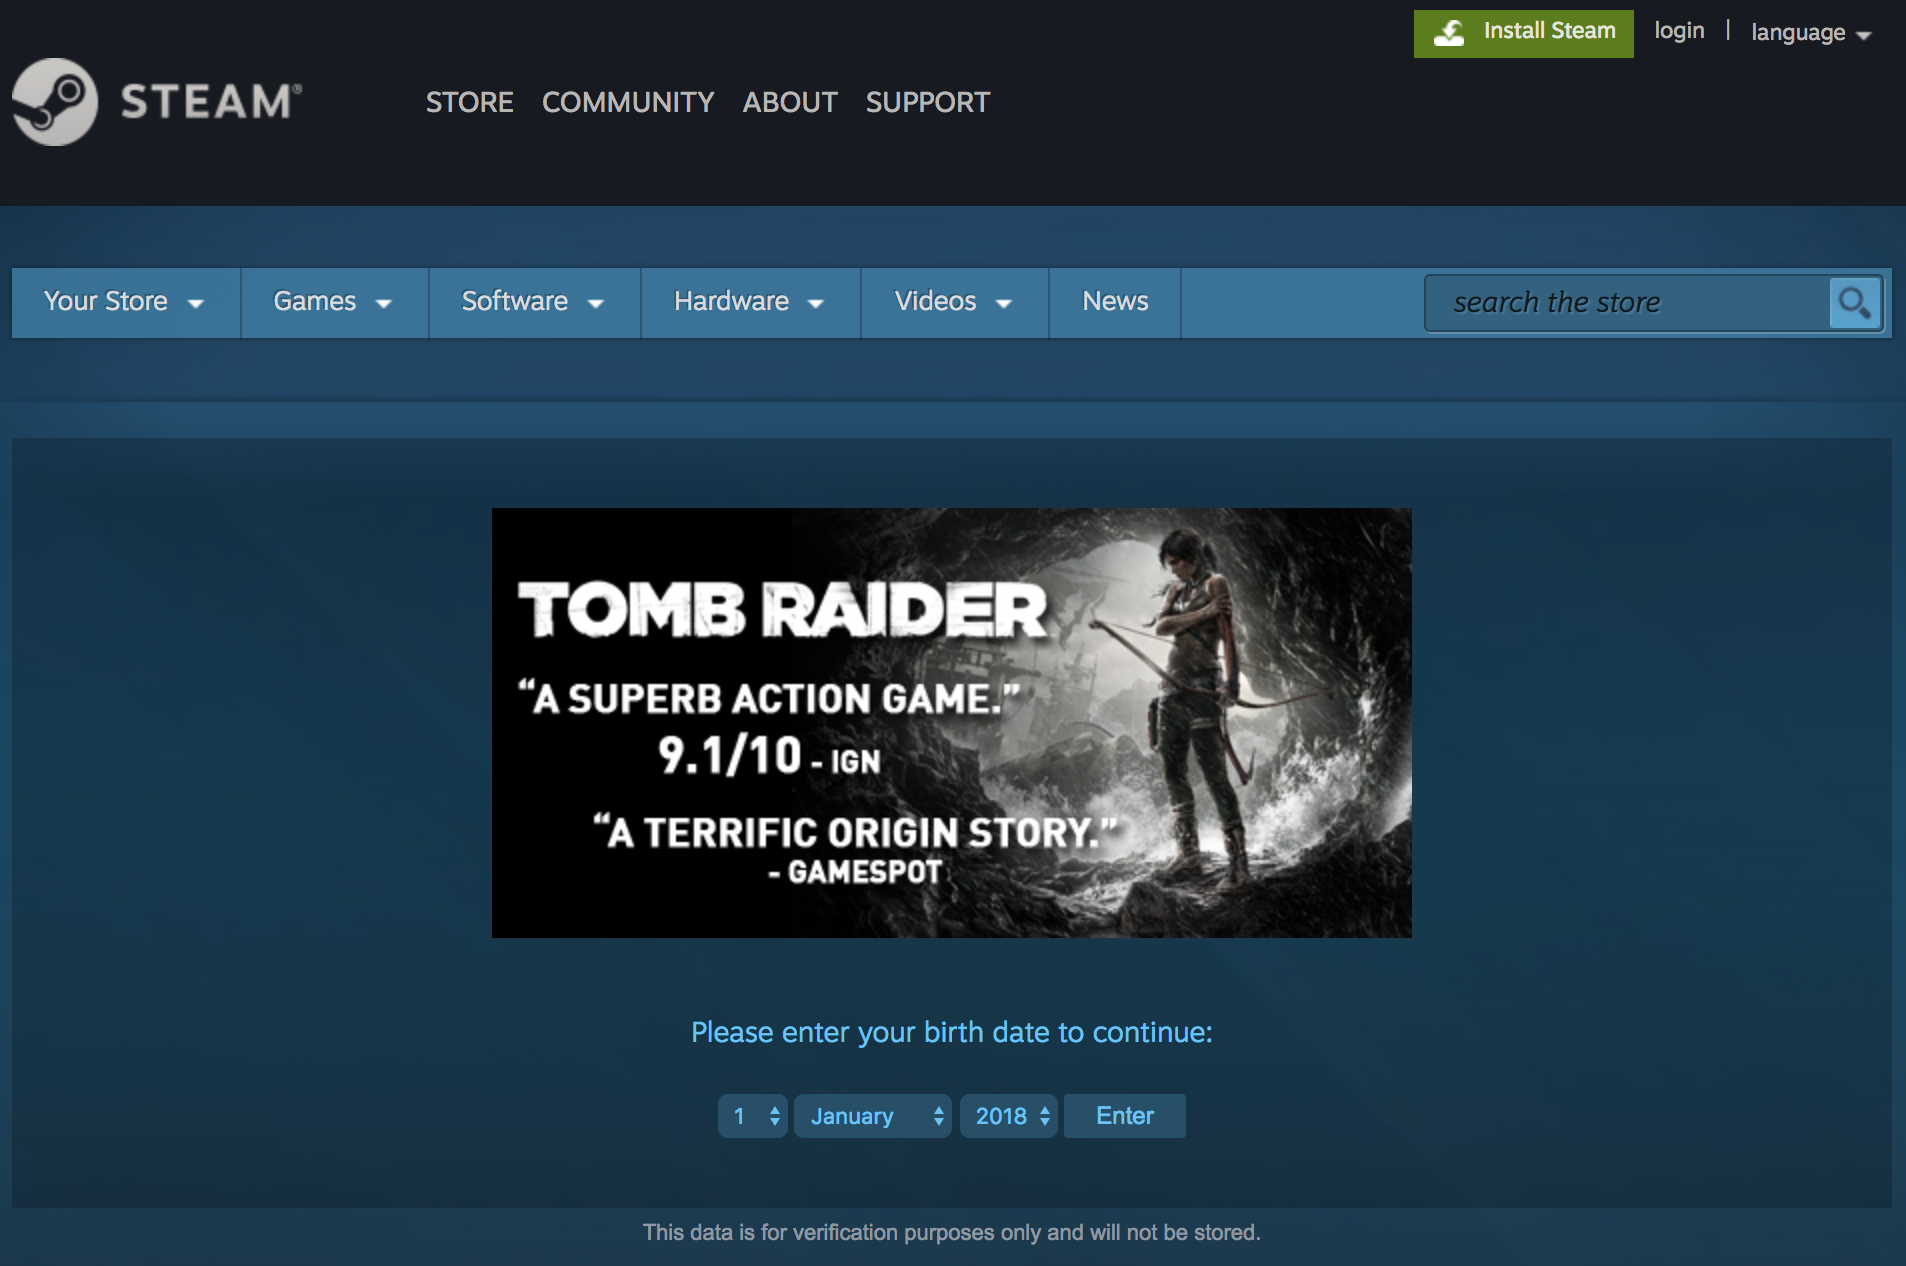
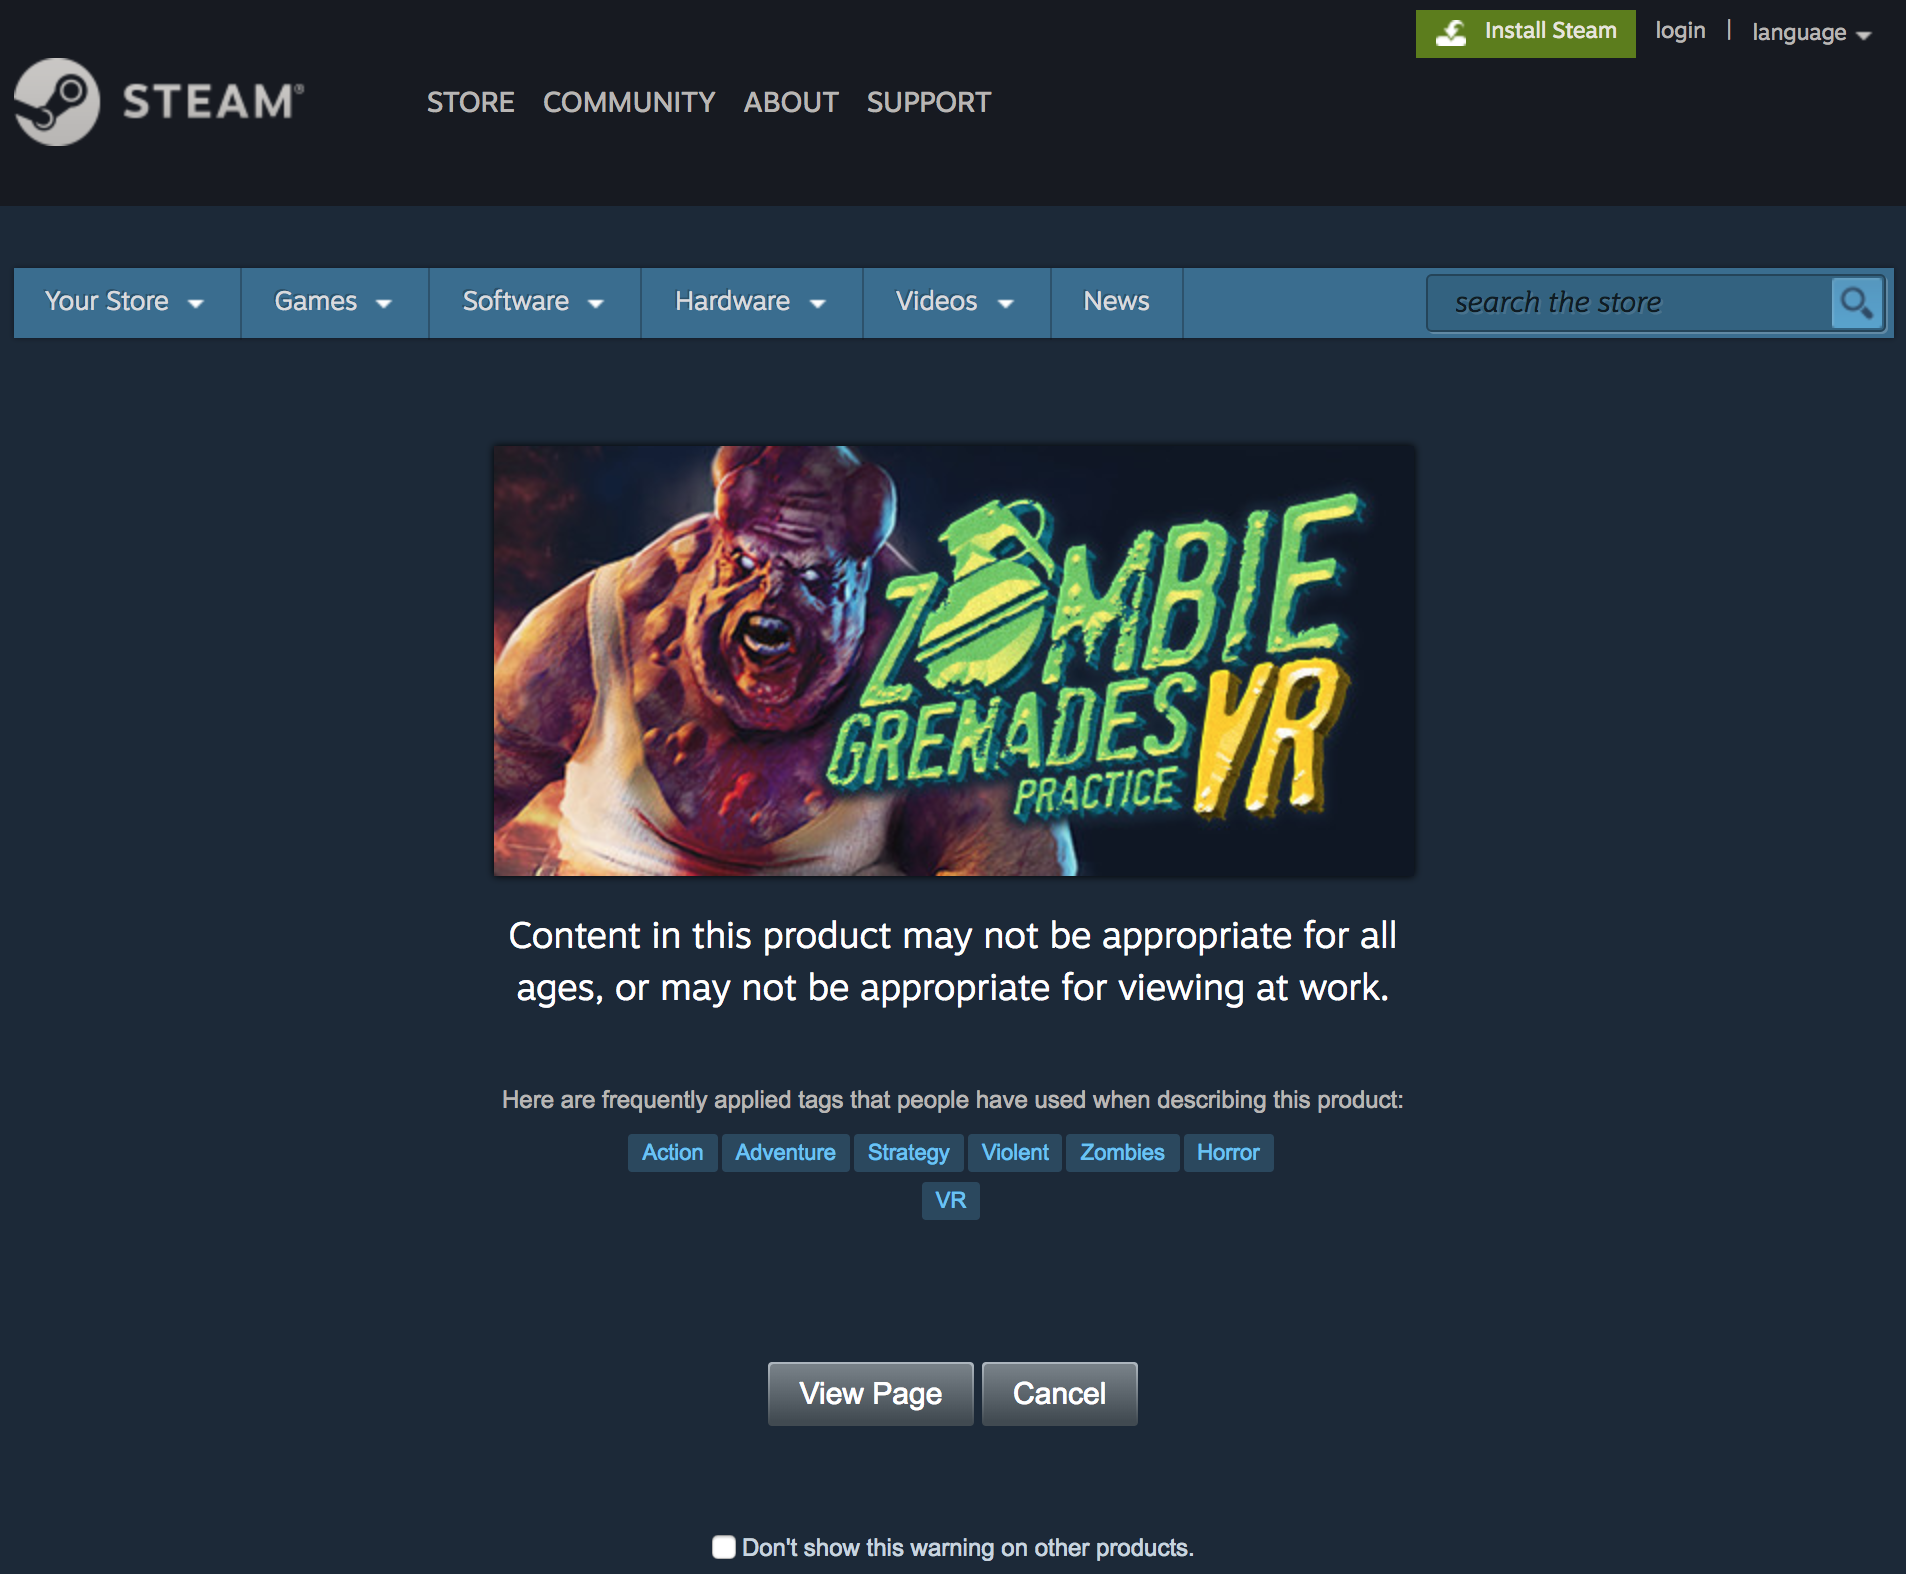
- Many games have two different types of form screen. One requires inputting a birth date to verify you’re old enough to view the page. The other type is simply a check that you’d like to continue to the site given the graphical nature of the content. Scrapy otherwise performed quite well for Steam, but it became more time consuming to try to get Scrapy to fill these forms correctly than to simply use Selenium. The take-away for me going forward is that if the site is “easy”, then my initial instinct to use Scrapy for speed and the ability to natively and browser-less-ly write a JSON file of results is a great option, but the moment the site is a bit tricky, it’s faster to use Selenium than to try forcing Scrapy to overcome the forms or scroll-to-load structure of some sites.
Example form page requiring a birth date to be entered:
Example form page requiring a simple click:
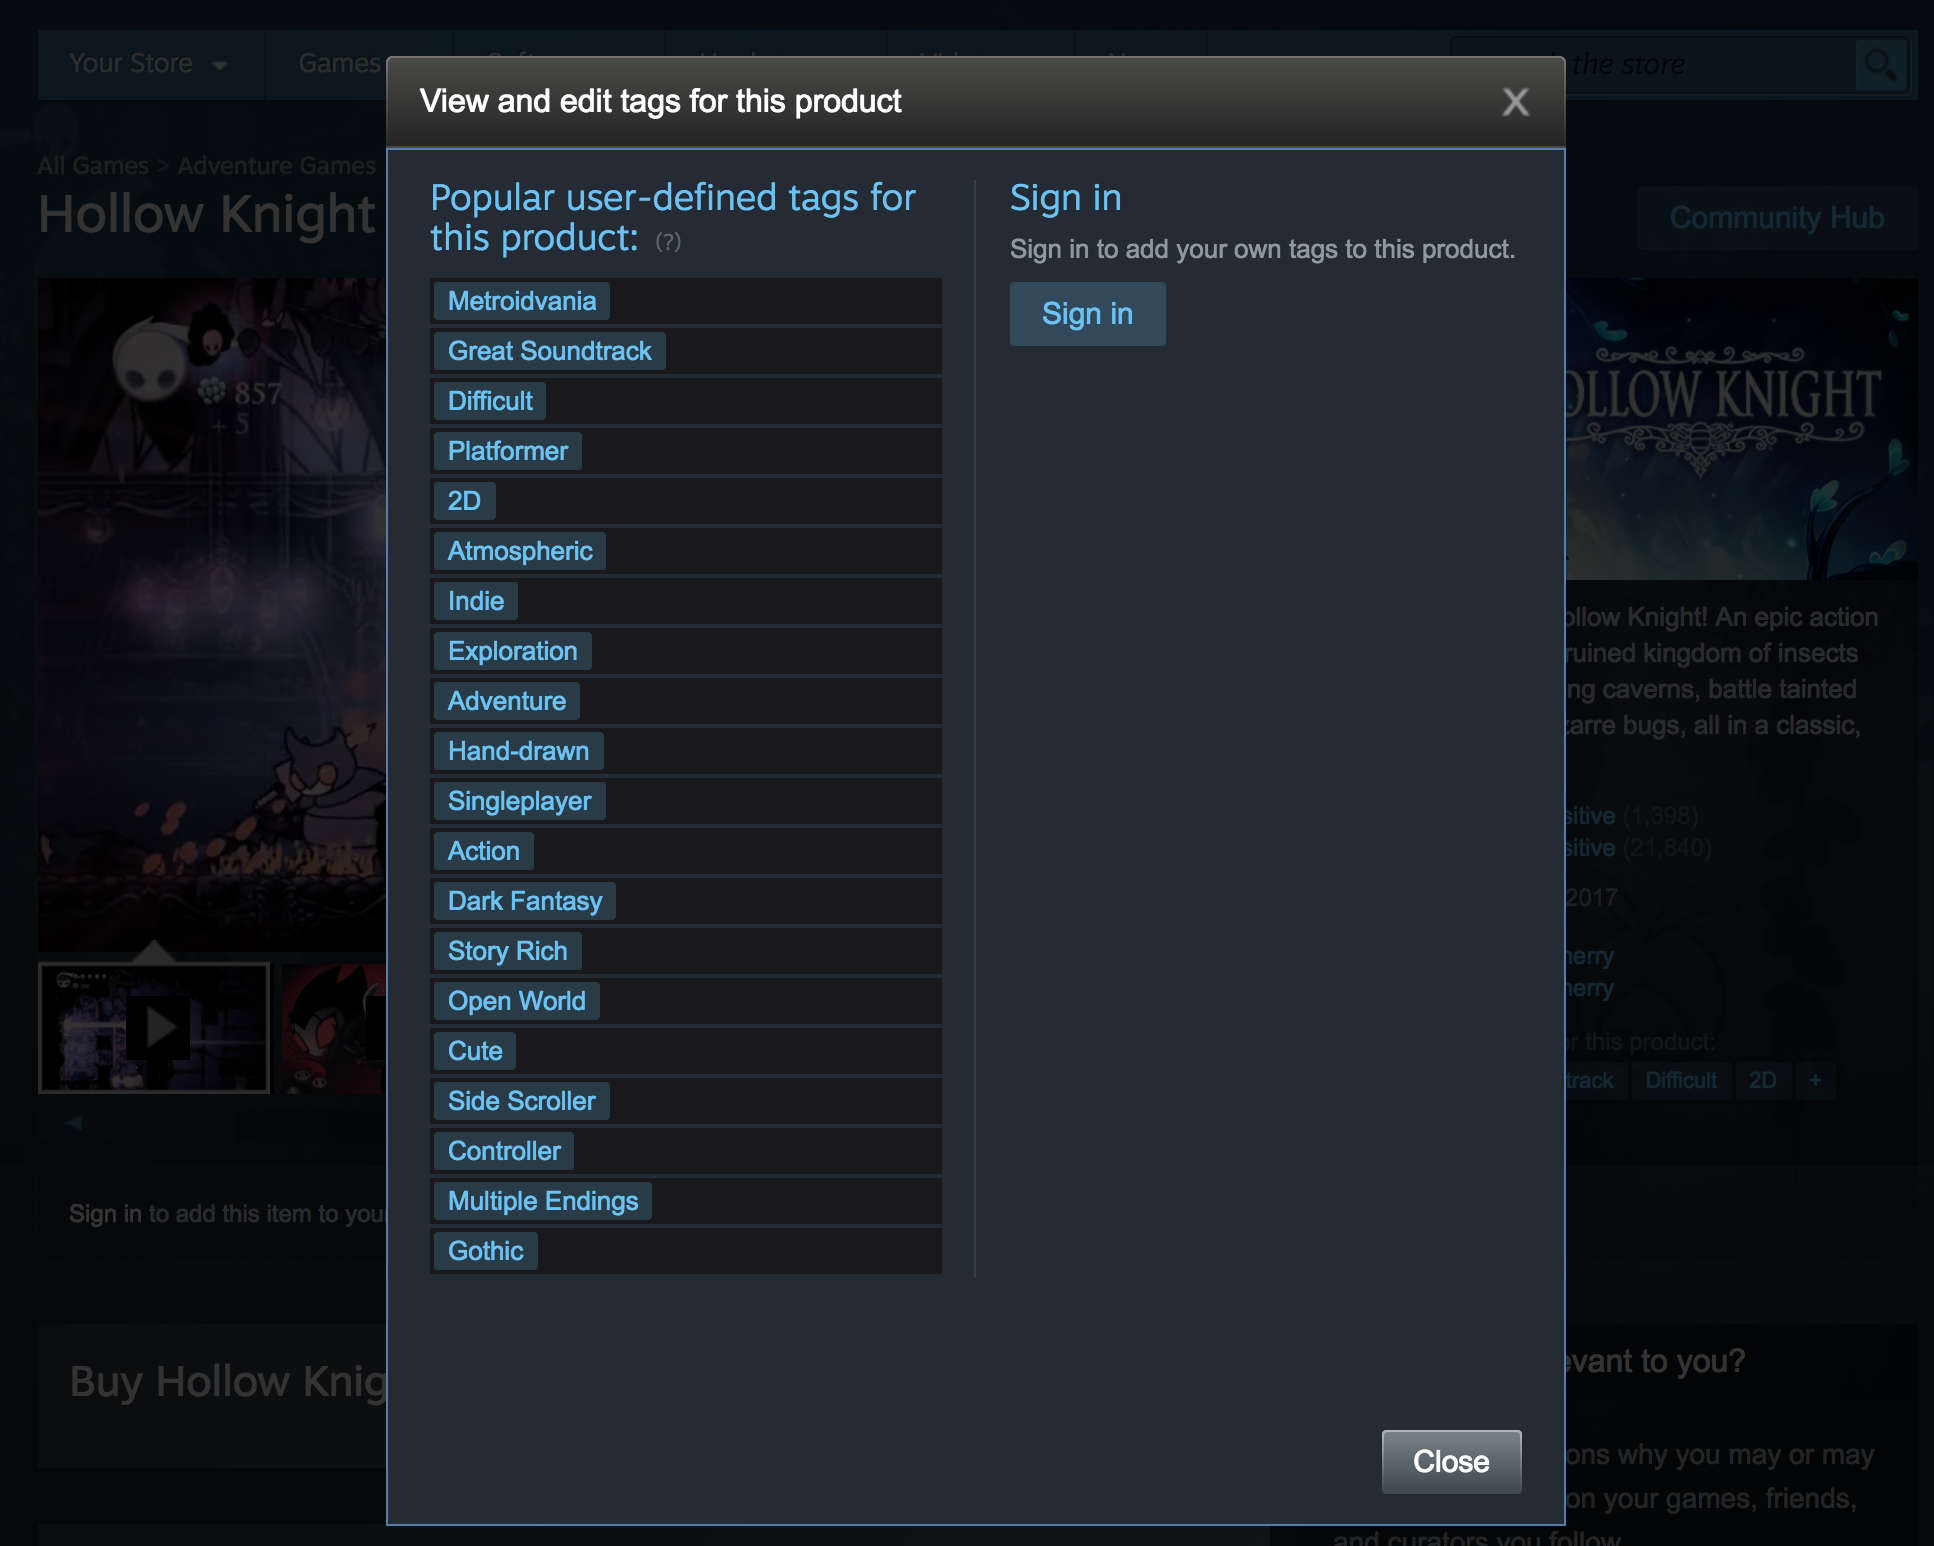
- Each game can have several user-defined tags, multiple publishers, multiple genres, etc. This made the dataset extremely attractive with respect to the richness and multi-dimensionality, but also made dealing with it a bit more challenging. Dealing with several values for each game for each feature required writing a bit of code to unpack these values before creating dummy variables from these categorical variables.
Example user defined tags:
- The names of the games did not match perfectly between Steam and SteamDB for some reason, so I had to use fuzzy matching to merge the two dataframes.
- Certain codes on the site were not standardized, such as free games being listed as “Free”, “Free to play”, “Free to Play”, “Free Demo”, etc. I hadn’t anticipated this initially, so there was some data cleaning downstream requiring greater and greater flexibility in dealing with them to bring values into a consistent data type and using consistent values for redundant cases.
Data:
I’ve included the scraped data in the repo: steam_games_dicts_selenium.json from Steam and steam_users_table.csv from SteamDB.
Tools used for webscraping:
Python, pandas, Selenium, beautifulsoup, fuzzywuzzy.
Tools used for linear regression:
Python, pandas, statsmodels, scikitlearn, matplotlib, seaborn.
Links to my code and slide deck for presentation:
The repository for this project is here: https://github.com/Jack-Etheredge/Steam-Webscraping-Linear-Regression
I summarized the process of acquiring and modeling this data in this talk.
To do:
- Add picture of plots.
- Add the narrative from the presentation.
- Upload an updated version of the talk.