I used several supervised machine learning algorithms to predict early hospital readmissions based on a dataset available from UCI here originally part of this study. Additionally, I performed a cost benefit analysis to optimize a threshold for recall and precision. Finally, I made a simple Flask prediction app as well.
I summarized the process of modeling and interpreting this data in this talk.
Models compared:
-
Logistic regression
-
Linear Support vector machine (SVM)
-
SVM with radial basis function (RBF) kernel
-
K-Nearest Neighbors (KNN)
-
Decision Tree
-
Boosted Trees
-
Random Forest
-
Gaussian Naive Bayes
-
Bernoulli Naive Bayes
Data cleaning:
-
Replaced ID codes with their descriptions
-
Removed expired patients (since this unfairly increased model performance, as they were never readmitted)
-
Removed repeated patients (since this violated independence between observations)
-
Turned the multi-class problem into a binary classification problem.
I turned reduced the three initial classes (Not readmitted, readmitted >30 day, readmitted <30 days) into a binary classification problem (Not readmitted <30 days, Readmitted <30 days). This decision was motivated both by hospital cost incentives (hospitals can be penalized for high rates of early readmission) and because it is a more practically addressed problem at the level of patient health as well (you’re much more likely to be able to avoid a <30 day readmission than a 30-90 day readmission). 90 day readmission is another common metric that is used in healthcare, so it’s possible that’s the range for the >30 day class, but I’m left to infer that, since as best as I could tell, this is not stated/clarified in the original paper.
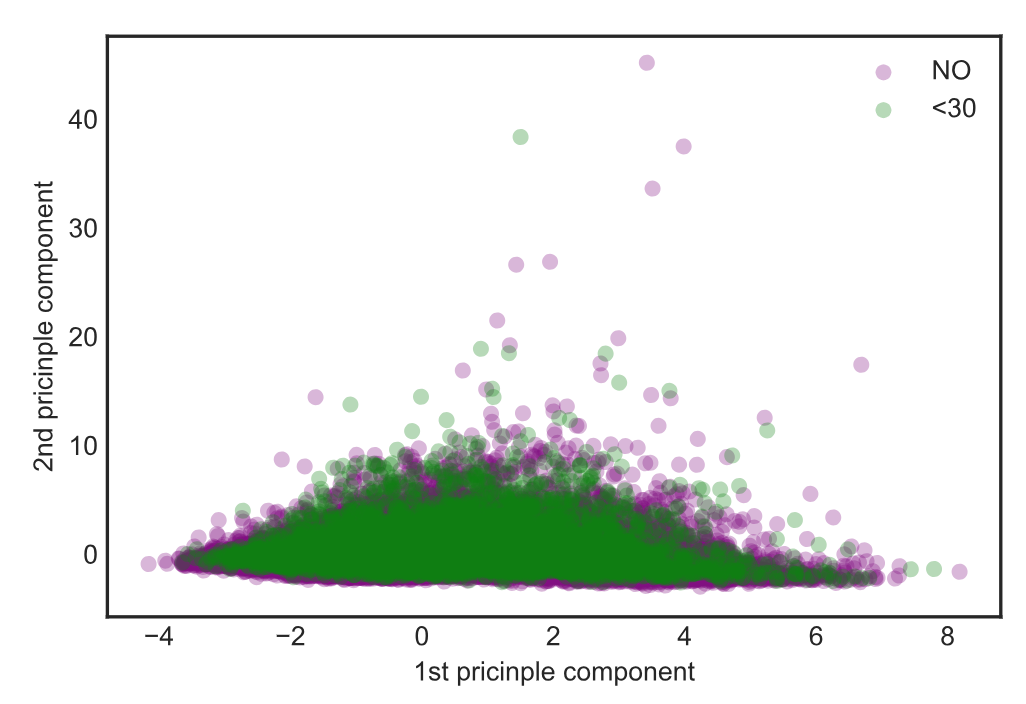
Class separability:
This was a relatively difficult supervised machine learning challenge, as we can see, since the two populations are not easily separable with unsupervised methods such as PCA.
Dealing with class imbalance:
-
Stratified test/train split
-
SMOTE oversampling
-
Random undersampling
Roughly 8 times as many patients in the dataset are not readmitted early, so test/train split was always performed stratified and I compared the performance of balanced class weights, SMOTE oversampling, and random undersampling with most of the models.
Random forest:
After optimizing hyperparameters for the various models to maximize recall, random forest performed best. I retained the top 25 of 252 features (many dummy variables for categoricals) based on their feature importance and retained most of my predictive power. These 25 features were used in the Flask predictor app. I’ve included the pickled model utilizing the top 25 features in my Github repo: randomforest.pkl.
I inferred directionality of these features through their correlation to the dependent variable (early readmission) after setting early readmissions to 1 and not early readmissions to 0. These coefficients can be used to identify patients at risk of early readmission independent of using the model to predict them. This could be useful in the case of identifying the most important patients to target for phone calls and home health care interventions (both shown to decrease readmission rates in a study linked to in my talk).
Cost function:
Since I focused on recall in a mostly negative population, my false negative rate was high, meaning that for every early readmission captured, several times more false negatives were predicted. A paper from University of Michigan found there are differences in expenses for different days of the hospital stay. This is a decay with the first day being the most expensive. For more details, see my talk, which also links to the paper. I used these values to make a cost function which found the “break even point”, where insurance companies (and/or patients) would not need to pay additional money, but would we would be able to minimize the number of early readmissions through an intervention of one additional day of hospital stay.
Tools learned so far:
-
Tools used for Classification: scikitlearn (Logistic, KNN, SVM, Decision Tree, Random Forest, Boosted Trees, Naive Bayes, Ensembling), imblearn.
-
Tools used for web visualizations and web apps: Flask, D3, (some javascript, HTML, CSS)
-
Tools used for Webscraping: Python, pandas, Selenium, beautifulsoup, fuzzywuzzy.
-
Tools used for Linear regression: Python, pandas, statsmodels, scikitlearn, matplotlib, seaborn.
-
Tools used for Cloud computing: AWS EC2, ssh.
-
Tools used for SQL: SQLAlchemy, psycopg, and PostgreSQL.