For my final Metis project, I decided to tackle brain tumor segmentation. Image segmentation is the process of finding objects and boundaries in images. Computationally, this requires making pixel-wise predictions and can be thought of as a classification problem with n object types being located and n+1 classes (one class is background or no object that we care about identifying).
This was my first time dealing with MRI data, so I had several things to learn. Even though my PhD is in neuroscience and developmental biology, this was my first time really doing much with human brain data of any kind, actually. I’ve always dealt in model organisms before.
In order to create segmentation masks for the tumor regions in the brain MRIs, I used a 3D U-Net convolutional neural network (CNN). I achieved this in Python using Keras with Tensorflow as the backend.
I trained the network from scratch on amazon web services (AWS) with GPU compute instances (p2.xlarge and p2.8xlarge). Getting Keras/Tensorflow code to work on multiple GPUs takes a bit of doing, and is something that I’ll detail soon in a tutorial post.
My Github repo for the project: https://github.com/Jack-Etheredge/Brain-Tumor-Segmentation-3D-UNet-CNN
This U-Net was built for the MICCAI BraTS dataset. This U-Net was based on the one constructed in this paper (Isensee 2017). The original U-Net paper is from 2015, so the architecture is still quite new. It performs extremely well for segmentation tasks that require a lot of precision and for which there is not a lot of example data. There were a total of 285 patients in this dataset. Typically, for neural networks to be trained well on image classification tasks, there are tens of thousands of example training images.
I cropped the images to 240x240x155 and used the four types of MRI contrasts per patient as different channels, yielding volumes with final input dimensions of 4x240x240x155.
The first half of the U-net is effectively a typical convolutional neural network like one would construct for an image classification task, with successive rounds of zero-padded ReLU-activated convolutions and ReLU-activated max-pooling layers. Instead of classification occurring at the “bottom” of the U, symmetrical upsampling and convolution layers are used to bring the pixel-wise prediction layer back to the original dimensions of the input image.
Here is the architecture for the 2D U-Net from the original publication mentioned earlier:
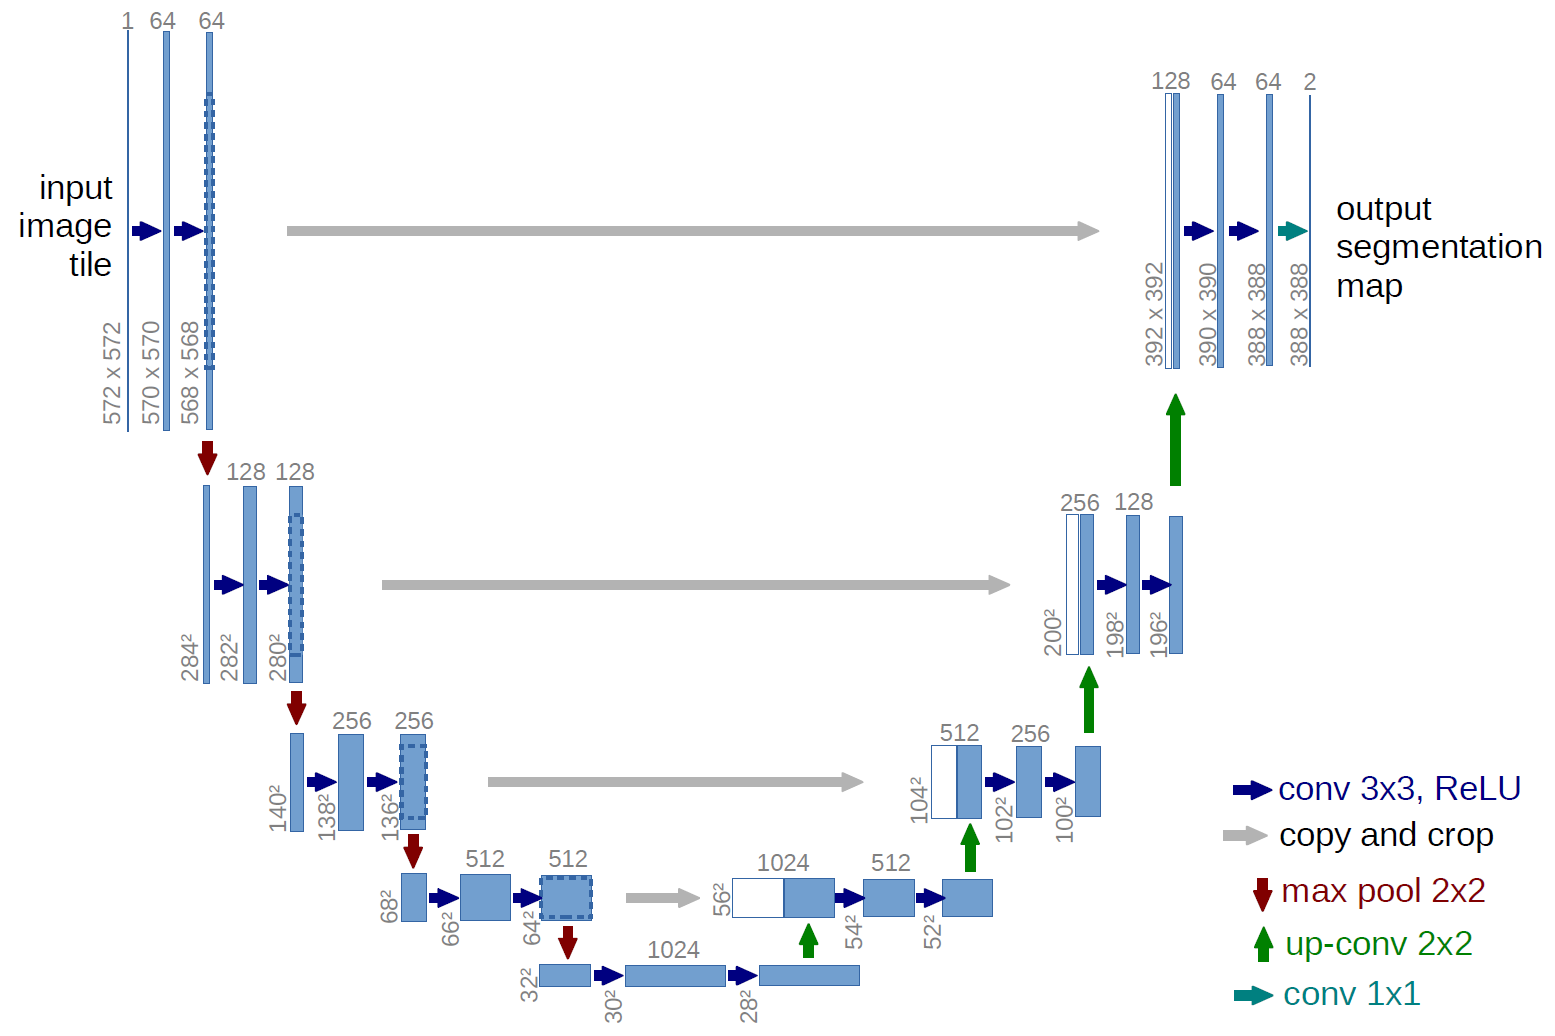
It is worth mentioning that a 3D U-Net is not the only way to tackle this problem. It could be done slice by slice with a 2D U-Net, or even without a U-Net using a more traditional convolutional-deconvolutional segmentation network without the concatenation between the convolution and deconvolution steps that are the defining element of a U-Net.
There are 3 tumor regions that are being determined in the ground truth and the predictions. From largest to smallest, these are:
- Edema^
- Enhancing tumor core
- Necrotic tumor core
The ground truth segmentation comes as a single channel coded 0,1,2,4 for the different regions and 0 as no tumor. I converted this to a 3-channel image with each channel corresponding to a single tumor region prediction of 0 or 1 for each pixel. Correspondingly, I output predictions for for the 3 tumor regions into separate channels with a binary classification for each channel.
Here’s an example of the correlation between my predictions in a single 2D plane:
| Ground Truth: | Prediction: |
|---|---|
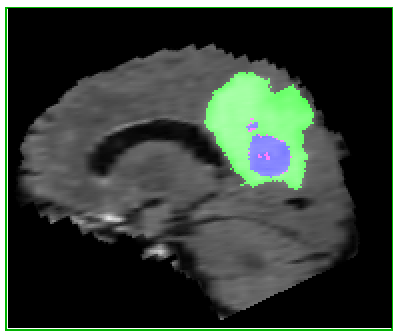 |
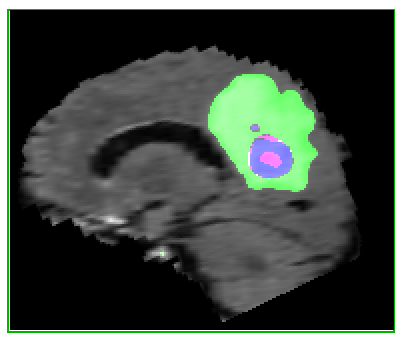 |
I achieved a whole-tumor dice score of 0.78 and weighted dice score of 0.67. The dice score is effectively the percentage of pixels that are the same between the prediction and the ground truth segmentation masks. In the case of 3D images, it’s more accurate to say that we’re checking the voxel-wise accuracy rather than pixel-wise accuracy, since we’re truly dealing with voxels (volume element, the 3D analogue of a pixel). The weighted dice score considers the prediction accuracy for each of the three masks.
Here’s an example of the correlation between my predictions in a 3D rotation:
| Ground Truth: | Prediction: |
|---|---|
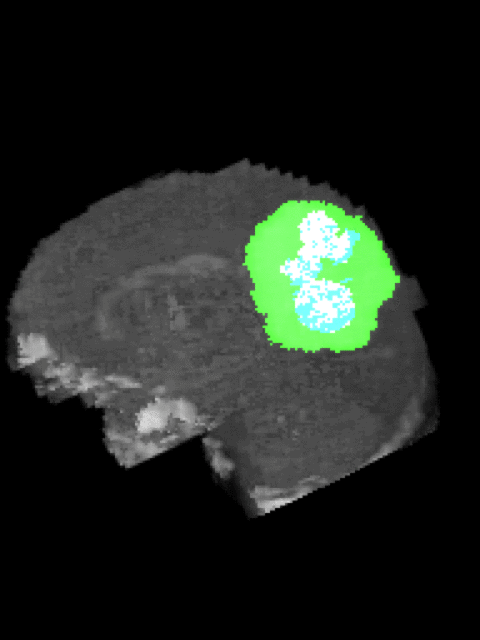 |
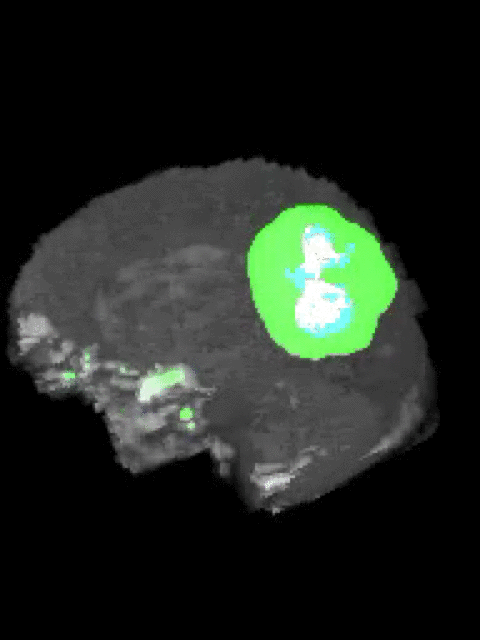 |
I probably could have squeezed out slightly better numbers if I hadn’t kept a holdout set for my predictions or I made that holdout set much smaller. I used 15% of the images for holdout to make prediction segmentation masks, which is a substantial percentage when dealing with only 285 images. In typical fashion for biology, a significant difficulty with this dataset is trying to squeeze insights from a small amount of data. In most other domains, the opposite problem is more common: there’s so much data that scalability becomes a problem.
Strangely, normalizing the images caused slightly worse performance. The lowest pixel value in every image was zero, however, so it’s possible that the version of the images I was using have already been normalized.
There are different grades of glioma. The BraTS dataset is separated into low-grade glioma (LGG) and high-grade glioma (HGG, also known as glioblastoma). I treated both tumor types (LGG and HGG) together. Papers that separate the task for each tumor subtype can perform better with respect to the dice score, but this is less appropriate for automation, because having different models for different tumor subtypes requires prior physician annotation to work correctly.
I also added predictions for length of survival and the glioma grade, but it unfortunately seems there were too few examples and too little correlation between the MRI data and these two variables to reasonably train the network. Some recent papers have had a degree of success predicting survival length using many features calculated from the MRIs, but did not predict directly from the same network or using the MRI images directly. In the process, however, I did learn a lot about creating custom architectures and creating networks with multiple inputs and outputs with different types of activation layers and loss calculations.
Future (tenuously) related project ideas:
- Cartoon machine: upscaling, colorizing, and style-transforming low resolution black and white cartoons. This is a rather ambitious project idea, and I think going all out would include feeding a transcript and producing audio in the voice of different voice actors.
I heavily modified code from two sources to get this project to work:
- Original code for building the U-Net was from this repo: https://github.com/ellisdg/3DUnetCNN
- Original code for the data generator: https://stanford.edu/~shervine/blog/keras-how-to-generate-data-on-the-fly.html
^As a biologist, I feel like I should clarify that while the documentation/description for the BraTS dataset considers the edema as part of the tumor, this is not quite true (as I’m sure most or all of the people using the dataset are well aware). Edema is basically pooling blood, so this is tissue around the tumor that might be damaged by swelling and increased vascularization from the tumor, but it not necessarily part of the actual tumor.
To do: Show an example of the 4 MRI subtypes Show the Z-slice video as a significant Show the rotation from the orthogonal axis